Debug Panel
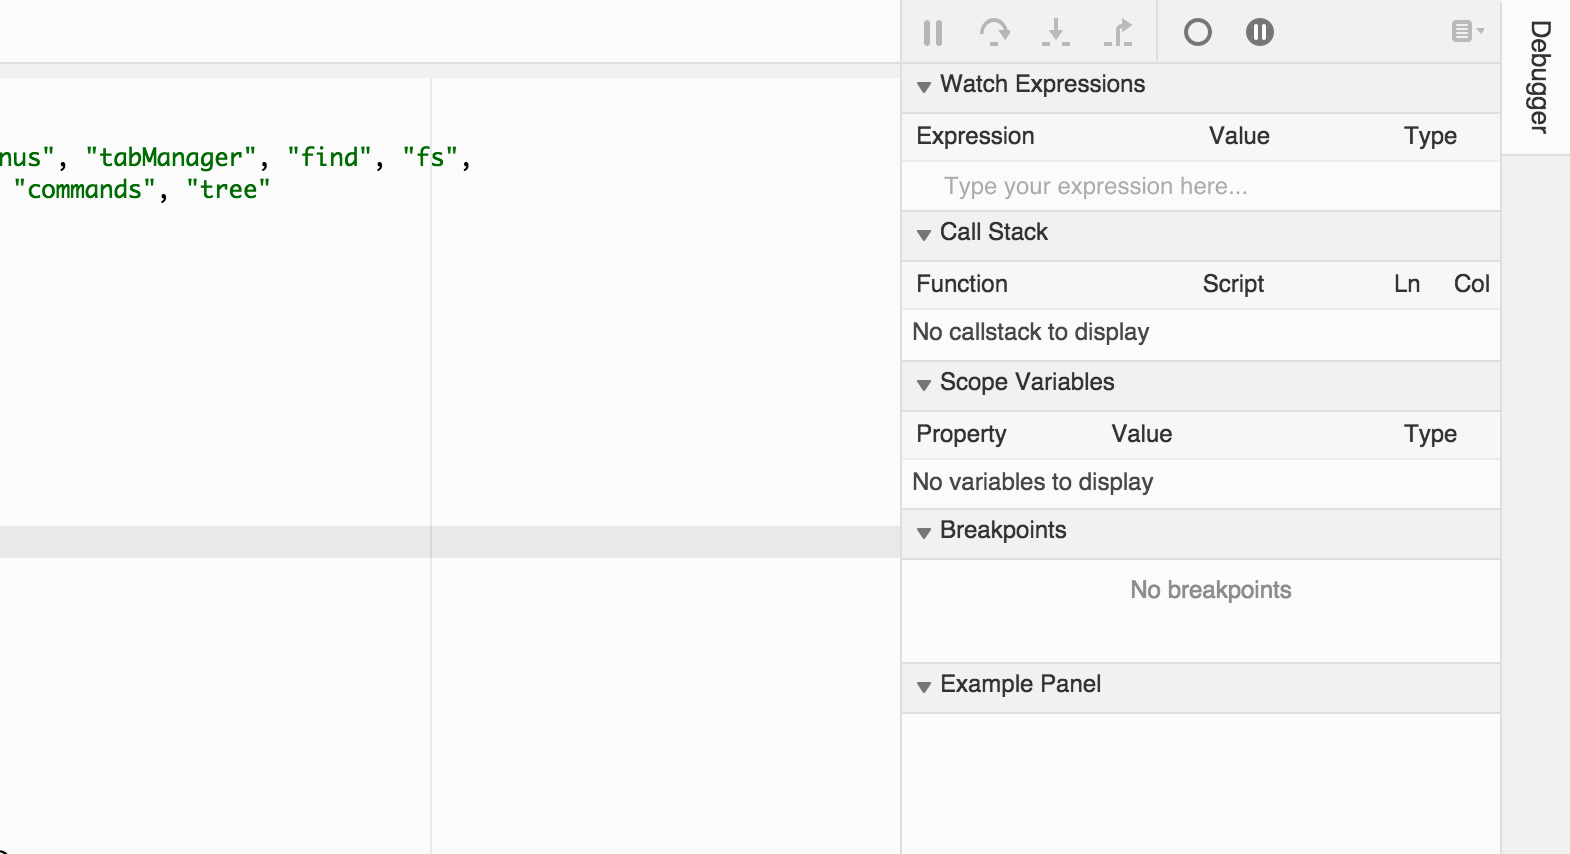
The debugger UI consists of panels that offer certain features. The basic panels are callstack, watches, variables and breakpoints. Debug panels can extend the feature set of the debugger by adding a UI that deals with other data types - perhaps specific to certain debugger implementations.
Creating a Debug Panel
A basic debug panel is created like this.
var plugin = new DebugPanel("Your Name", [], {
    caption: "Example Panel",
    index: 500
});
And looks like this.

Adding your own contents
The easiest way to populate a debug panel is by adding custom html and css. The following example loads css from debugpanel.css and adds a div element to the body of the dialog.
var plugin = new DebugPanel("Your Name", main.consumes, {
    caption: "Example Panel"
    index: 500
});

plugin.on("draw", function(e){
    // Insert css
    ui.insertCss(require("text!./debugpanel.css"), options.staticPrefix, plugin);

    // Set some custom HTML
    e.html.innerHTML = "<div class='myCSS'>Hello World</div>";
});
Make sure to check out theace widgets. They are used by most debug panels and might work well for you too
Interacting with the Debugger
Use the attach and detach events to listen to a new debugger attaching and detaching. This is the recommended way to fetch a reference to the current debugger implementation which you can use to interact with while connected.
var debug = imports.debugger;

var dbg;
debug.on("attach", function(e) {
    dbg = e.implementation;
});
debug.on("detach", function(e) {
    dbg = null;
});
Hide panel when not neededYour plugin must hide itself when a debugger implementation does not support your data types. You could add a new debugger feature and check for that in the
attachevent handler.debug.on("attach", function(e) { dbg = e.implementation; if (dbg.features.myCustomFeature) plugin.show(); else plugin.hide(); });
Updated 6 months ago
